Wednesday, October 28, 2020

Drupal 8 Module Development--A You Tube Video Formatter

 The objective of this module was to programmatically create a formatter in Drupal 8 to play a You Tube video.

The image below shows the video in a Drupal 8 website.


Drupal 8 Module Development --An interactive code-based form

 The objective of this module was to programmatically create a table in a database with four columns and to create an interactive form into which data can be entered and saved in the table.

The image below shows the form with data on clothing materials carried by  Moxy Clothing Inc.


Drupal 8 Module Development -- A Welcome Message

 The objective of this module  was to present a welcome mesage in various formats to a logged in user to a Drupal 8 website.

In the first format, the message is presented on the main content page and in the left sidebar.  Two different messages are presented in this format.


In the next format, the welcome message is first written into a configuration form which is saved.  This message is them presented to the user when he/she logs in for the first time.


In  the third format, the message is changed.  The message in the left sidebar is not the same as that in the main content page.


Monday, September 7, 2020

Drupal 8 Module to programmatically create a database and tables

 The objective of this module was to programmatically create a database of Metsi employees, their respective departments and the location of the departments.  Metsi has sixteen employees in four departments located in two buildings in the Ottawa, Canada region.  The departments are software development, new software testing, IT Education, and software promotion.

There are two tables in the database that were created programmatically using hook schema: employee name and department, and department name and location.

The names of the employees were then outputted to a table with 8 employees per page with the option to go to the next page.

The following screenshot shows the table of Metsi employees with a table header and a pager.

New fields and data were added to the tables as updates using Drush.


Using Drupal 8 to expose database fields to Views

There are two tables in this database each with four fields.  The objective of this project was to extract the information in those fields using Views.  Because data in the table fields are different, the tables had to be joined in order to extract the information from both table fields.  The relationship feature of Views was used for this. 

To get going, a new view was created in the Admin->Structure->Views menu.  A table was created in Views and the database table fields were extracted and added to the Views table.  The table below shows the result using Views.  The information was organized as follows: player ID, player name, team ID, team name and team description.  A pager was added to the Views table set to allow 8 items per page.

Provisions were included for filters and sorters to be applied to the extracted data.

Views table showing data from two joined database tables


Tuesday, July 7, 2020

Creating an Interactive Webform with Visual Cobol 6.0 and Visual Studio 2019

This project was created using Visual COBOL 6.0 and Visual Studio 2019.  The objective was to interactively extract data from an indexed COBOL datafile and apply the result to a webform.

To begin, start up Visual Studio. Select File, New, Project.  Select ASP.NET Web Application for COBOL as the template.  Framework should be .NET Framework 4.6.

Give the project a name and a storage location. Click Create.  This should open up a form.

Go to Solution Explorer and add the projects LegacyBook and BookWrapper to the application as well as into the reference of the application.  LegacyBook is a procedural COBOL project that contains the business logic which the form can use.  LegacyBook uses COBOL types such as PIC X and PIC 99V99.  The BookWrapper project converts data from .NET types to COBOL types.

Note that LegacyBook requires a copybook (book-rec.cpy) and so does the BookWrapper project (book-rec-dotnet.cpy).

At this point, it is time to paint the Webform.  Painting the labels, buttons and textboxes on to the form was done by direct coding in the Default.aspx file and not by dragging and dropping them from the Toolbox.  The attachment below shows the Default.aspx file with the coding for this project.


The Default.aspx file showing the coding for the webform

Once the form has been drawn, it is time to add the following code to the Web.config file.


The Web.config file

Note that the indexed COBOL data file (bookfile.dat) is added to the Web.config file.


Next add the following code in the Default.aspx.cbl file.


The Default.aspx.cbl file that activates all the controls on the form

 This file activates the Search button, populates the form from the datafile and manages any error handling.

 At this point, there should be no errors in the project as shown on the bottom left of the Visual Studio screen.

 Run the application if no errors are identified.  Select Rebuild and then Debug, Start without Debugging.

 Visual Studio will  complete the above two processes and finally display the form.

 To display the results, enter four digits (from 1111 to 6666) in the book number field and click Search.


The completed webform with a search result for book number 2222

The form should be filled up with the results of the search.  The following shows a search for book number 2222.


Friday, February 21, 2020

Using PHP, HTML, CSS and javascript to create an example on-line Store

The objective of this project is to create a small on-line store with a few example products using PHP, HTML5 andCSS3.  The project begins with the setting up of a database and tables with queries on the PhpMyAdmin menu.  This includes adding descriptors such as size and color to the example products in the appropriate table and also JPG images of the products.

The information in the database tables can be retrieved through a database connection using localhost, username (root) and a password (optional).  The results include a visual presentation of the categories of products which when clicked displays the details of each product including an image, a short description, the price and available colors.

When javascript is applied to the project, the products in each category can be viewed by means of an arrow slider created by the javascript.

The truncated screencast below shows the example products, etc. in each category with an arrow slider at the top right (faintly seen) to view one product after the next.

Example Products in the On-Line Store

Monday, February 17, 2020

Transferring the data table from Relativity Designer to Excel Spreadsheet

Moving the Designer Table into Excel

This blog continues where the last one ends........

......After the table from the Cobol data source has been generated by Relativity Designer, the next steps will be to transfer that table to an Excel spreadsheet and to prepare bar graphs, line graphs, etc.

Here are the steps:

1. Open Excel.
2. Click on Data.
3. On the left of the Excel Menu, click on the down arrow on GetData.
4. Select from other sources->From Microsoft Query.
5. On Choose DataSource, select your data source. In my case, it was edward; see previous blog to find where edward was used.
6. Click OK.  A login form will appear.
7. Insert your name and password (password optional).
8. Click OK.
9. A Query Wizard --Choose Columns will appear.
10. Unravel Orders table (clicking on +).
11. Select columns to include in the query.
12. Query Wizard --Filter data. Select next.
13. Query Wizard -- Sort order (I selected Customer Number -- Ascending).
14. Query Wizard -- Finish; Select Finish.
15. Import Data Table --Existing Spreadsheet.
16.  The result will appear on an Excel spreadsheet.

The attached spreadsheet shows the table.

Excel Spreadsheet of table generated in Relativity Designer


Inserting a Chart into the spreadsheet

17. To insert a chart, click on Insert on Excel Menu.
18. Select Pivot Table.
19. Select a table or range.
20. Table range = Table_Query_from_edward.
21. Select New worksheet; click OK.
22. To the right, select Order date, order value, total order value.
23. Grab and pull order date into filters box.
24. Click on insert on Excel menu.
25. Select a suitable chart.
26. Place chart on an Excel spreadsheet.

The attached graphs show the bar graph generated from the above table.

Bar graph generated from Excel Spreadsheet by Year

Table showing results by quarter and by year


Bar Graph displaying results by Quarter and by Year.


Sunday, February 16, 2020

Using the MicroFocus Relativity Designer Suite 23

As I understand it, the goal of the MicroFocus Relativity Designer is to take a Cobol data source and convert it to an Excel spreadsheet so that the data can be analyzed by creating tables, bar graphs, pie charts etc. to inform decision-making.  The neat thing about the Designer is that the structure of the Cobol source code and the source data for the program remain intact and not changed in any way.

In this project, instead of using my own Cobol data source, in the interest of expediency, I used the SHIRT-2 data source provided by MicroFocus in it Relativity Designer Samples found under MicroFocus Relativity Designer in the Microsoft Windows 10 Start Menu.

Before starting up the Designer, make sure you install your Product Licence on your computer.  Also, save the Catalog in the same folder as your Cobol data source.  For example, I used SHIRT-2 Cobol data source under Relativity Samples and saved my catalog name in this folder.  Also, the Cobol source code (orders02.cbl) is located in this folder.

Now, to start using Relativity Designer, select Relativity Designer in the start menu of Windows 10, and click on Designer.  The Designer worksheet opens.

Select File, Create Data Source.  Select a type of data source, then chose User Data source (applies to this machine only).
Select a driver for which you want to set up a data source.  Select MicroFocus Relativity Data Manager (32-bit).

Click Finish.

At this point, enter a Data Source Name (e.g. I used edward-- you can choose your own name).
Two options are then presented: Select a Catalog (if one is already created) or Create a Catalog.

Choose Create a Catalog.

In the window, "Create Catalog for data source, navigate to the SHIRT-2 folder (samples-> MF -> SHIRT-2).  Enter a name (any name would do) in the textbox,  For example, I entered harry.

A message will appear that harry.rcg was successfully created. Click on apply and then OK.

At this point, the following will show up in the Catalog Explorer:

  • File Definitions
  • Table Definitions
  • User Group and Users
Select User Group and Users-> new group-> add owner group-> add owner name (e.g. moe, no password).  Click Add.  (This will allow the database administrator to register only reliable users to use Relativity Designer and to have access to the Cobol data and program structure.  The individual signs up when they open up Relativity Designer).

Next, click on File->Import Cobol FDs.  This will Read File and Record Descriptions.

Select File Descriptions (FDs) to import.  These files will be added to the catalog:
  • orders02 -- Customer-2-File
  • orders02 -- order-file
  • orders02 -- Product2-file
  • orders02 -- Description-file
  • orders02 -- Sales-file

Under File Definitions in the Calalog Explorer, right click on order-file->show file definitions.
The order-file will appear in the Main Designer window.  The Cobol structure and the design names will appear.

Go to Table Definitions -> right click ->New Table Definitions.

Add columns to Table Definitions, e.g.
  • order number
  • order date
  • total order value
  • Item count
  • Product number
  • Quantity
  • Order value
Add selected columns.

The selected columns will then be added to the Orders-Table Definition.  Click on Save to catalog.

Right click on Orders Table (on the side), click on View Data.

The full table with the selected columns will appear.

The attached screenshots show two tables from two Cobol data sources run through Relativity Designer.


The table generated with Relativity Designer from the Customer table

The table generated with Relativity Designer from the orders table

At this point, you are still in the Designer.

The next step will be to transfer the Table to Excel and to analyze the data using charts, graphs, pie charts, etc.  The next blog will take you through these steps.


Saturday, February 15, 2020

Creating a DataGrid View and a Details View on a Windows Application form using Visual Basic, Visual Studio 2019 and an Access Database

This project was created using Visual Basic with Visual Studio as the IDE.  The objective was to grab data from a Microsoft Access database  and add that on to a Visual Basic Windows application form in two formats: as a DataGridView and as a Details View.

The project outline is as follows:

  • A new project is created as a Windows application in Visual Basic using the Visual Studio 2019 IDE.
  • Click on View on the Visual Studio menu, select Other Windows and then Data Sources.
  • On the Data Source window, click Add new Data Source as the Data Source Configuration Wizard opens.
  • On the choose a Data Source Type, select Database and click next.
  • On the Choose a Database Model, select Dataset and next.
  • Select New Connection on the Choose Your Data Connection.  On the Add Connection form, navigate to the Microsof Database File for the data source.
  • In the Database File Name of the form, specify the path and name of the .mdb file you want to work with.  (In my case, I choose the xtreme.mdb database).
  • Click on the Test Connection; answer should be test connect successful.
  • Then click OK.
  • On the Choose Your data connection, select next.
  • Select next on the save Connection string to the application Configuration page.
  • Expand the tables in the database on the left and choose your database objects.
  • Select the table you wish to work with in your dataset and select Finish.
The dataset is now added to your project and the tables and views appear in the DataSources window..  You are now ready to move the data from the database and tables in DataSources on to the Windows Visual Basic form.

This can be done using a DataGrid View control by dragging the DataGrid View control on to the form.

  • Run the project.  The data in the table will then be loaded on to the DatagridView.
To view the table data in the Details format click and drag the Details view from the table on to the form

  • Run the project.  The result will show the details in a tabular format.
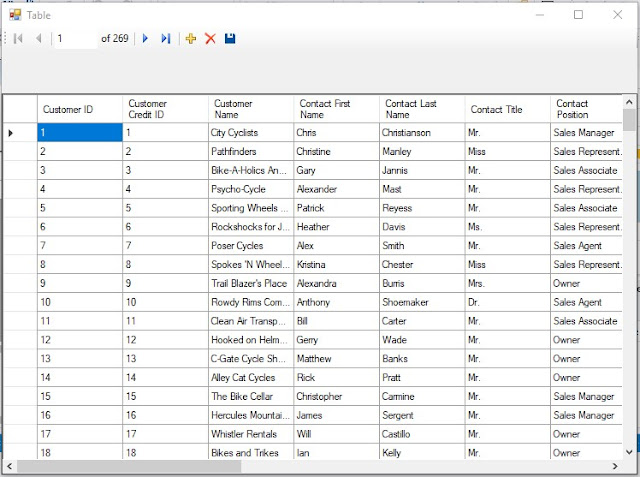
These two screenshots show first the DataGridView and second the Details View.


DataGrid View

Details View


Creating a DataGridView on a Webform using Visual Basic, Visual Studio 2019 and an Access Database


A. Creating the webform.

1. Start up Visual Studio 2019.
2. Select Continue without code.
3. On the page that opens up, click on File, New, Project.
4. Select ASP.NET Web Application (.NET Framework) in Visual Basic, Windows, Cloud, Web.
5. Click next.
6. Give the project a name (e.g.WebApplication) and a location.
7. Click Create.
8. Visual Studio will create the project and open up the Webform.  If the webform does not appear, click on Solution Explorer.
9. Right click on Default.aspx and select View Designer.  The webform will appear with ASP.NET at the top.
10. Place the cursor to the right of ASP.NET and press Enter about 4 times.
11. This will create 4 empty lines on the webform.
12. Switch to the Toolbox (View, Toolbox).
13. Scroll down to Data, select GridView and drag and drop it on the form.
14. Next to the GridView grid, a menu appears (GridView Tasks).
15. At Choose Data Source, click on the drop down arrow and select New Data Source.

B. Adding the Database

16. In the Data Source Configuration Wizard, select Database and click OK.  The SqlDataSource1 automatically shows up as Specify an ID for the data source.
17. Click OK.
18.  In the window that opens "Choose Your Data Connection", Select New Connection.
19. In the Add Connection form, the Data Source automatically registers as MicroSoft Access Database file (OLEDB).
20. Browse to the Access database file name you plan to use.
21.  Click on Test Connection; should say it was successful.
22. Click OK, next, next.
23.  In the form that opens up "Configure Data Source--SqlDataSource1.
24. Select "Specify columns from a table or view".
25. A click on the down arrow reveals that the xtreme database I am using has several tables.  I selected the Employee table.
26. Tick off the columns you plan to show in your webform.  I selected Employee ID, Last Name, First Name, Position, Home Phone.
27.  To the right of this form are 3 buttons.
28. Select the "Order by Button" and click on Last Name (I selected Last Name to sort in ascending order).
29.  Click next, and then Test Query on the next page.  Th result should show the data returned by this data source ordered by Last Name.
30. Click Finish.  This bring us back to the .NET webform with the gridview and GridView Tasks.

C. The GridView1 Properties.

31.  Notice that the SQLDataSource1 has been automatically added to the DataSource ID in the Properties window and that the EmployeeID has been added to DataKeyNames.
32.  Click on DataKeyNames and then on the ellipsis.
33.  This opens up two squares; one with the available data fields and the other "Selected data fields".
34. Move the datafields from the left to the right using the > arrow.
35. When done, click OK.

D. Run the project.

36.  Click on IIS Express on the Visual Studio Menu.
37. Let the project build and then open up in the web browser (Google Chrome in my case).
38.  The results should show the data in the GridView of the webform (will take some time to appear).

Below is the result of the data from the Book table of the Library.mdb Access database and the Employee table of the xtreme.mdb database using Visual Basic and Visual Studio 2019.
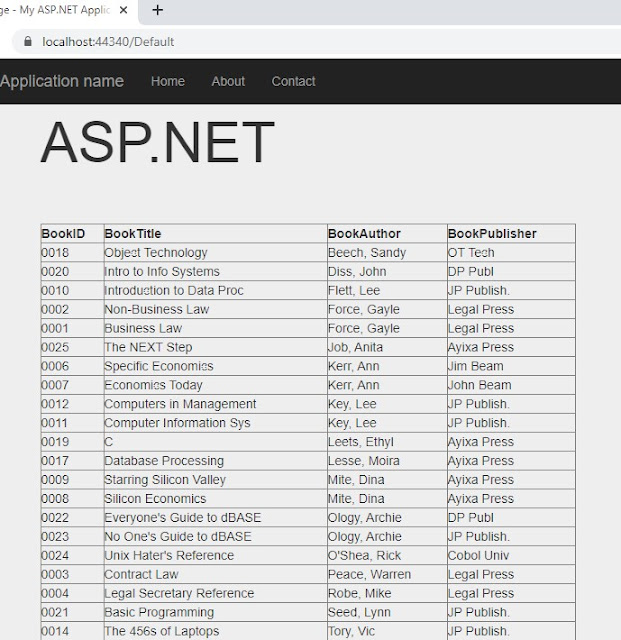
Grid View result of the Book table from the Library database


GridView result from the Employee table of the xtreme database.


.
19

Sunday, February 9, 2020

A Drupal 8 website project for Silver Seven Socks

This project was created at the request of Silver Seven Socks Inc.  The objective was to develop a fully-functional website displaying sock samples for both men and women.

The final result of the project was a website that has a special feature slideshow on the front page, including policy information on the sidebar. On the main menu are clickable tabs on men's socks and women's socks.  Clicking on one of the tabs takes you to a full display of men's and women's socks which can be browsed by the customer.There is also a location tab showing a google map of the store location and also a video tab showing the story of Silver Seven Socks and the sock business.The following screenshots show various aspects of the website.


One slide on the frontpage slideshow, a left sidebar, and five tabs on the main menu


Another slide on the frontpage slideshow


A third slide on the frontpage slideshow

When the tab on the front page is clicked, this page opens up showing a sample of men's socks


When the tab on the front page is clicked, this page opens up showing a sample of women's socks


Location Map


Saturday, February 8, 2020

My Understanding of the Use of Micro Focus Relativity Designer

The data in COBOL source files, whether sequential, relative or indexed, can be retrieved by the COBOL source program for which it is designed.  The results will be laid out based on the structure of the COBOL program.  For the results to be presented another way to gain new information, the program structure has to be rewritten.  Many IT service organizations use sometimes hundreds of COBOL programs with millions of lines of code to provide consistent, reliable, and secure service to their clients.  Any rewrite of COBOL programs and codes to get another desired result could cost service providers an enormous amount of downtime to their clients, probably loss of data security, and a significant amount of developers' time and effort.  One service provider estimated that it would take four program developers at least four years to reprogram the structures of all their COBOL programs at an enormous cost.  The return on investment (ROI) would not be worth the effort.

Micro Focus  has developed a tool, the Relativity Designer, to extract the structured data in COBOL programs and to present it in an Excel spreadsheet format.  The neat thing about this approach is that the Cobol program structure remains intact and is not broken in any way.  The data structure of the Cobol program also remains intact.

In Excel format, the data can be analyzed by means of tables, graphs, charts, etc. to assess relationships between various elements in the COBOL source data.  Secure data in Excel files can be passed on to secure clients of service providers to be used by them to retrieve relationships of interest to them.  Relativity has a built in measure to allow only authorized personnel to access the Relativity tool and the results of the Excel spreadsheets.

Recently, I had the opportunity to work with Relativity Designer on some of my clients' COBOL source data as well as on the Relativity Samples provided by Micro Focus.  I found Relativity Designer very easy to use and I would like to share my experience in using the tool.

My next blog will detail the use of Relativity.

Creating a Hello message custom module using Drupal 8.

This blog outlines my experience creating a welcome message to the current website user using three approaches in a Drupal 8 module.  The first approach is to have the user name pulled out of Drupal currentUser and displayed on the website with the welcome message.  This message is displayed only when the user signs in to the website; it disappears altogether when the user moves away from the home page.  One way to keep the message on the site even when the user moves away from the home page is to create a Welcome link on the main menu so that when the link is clicked, the welcome message appears on the front page.The second approach is to create a block and have the currentUser name pulled out using Dependency Injection and displayed with the message.  The block will be a permanent fixture on the website and remains on the site at all times.The third method is to download the Token module from Drupal.org and use that to add the currentUser to the message.  The message is placed in a block on the front page.  The block can also be configured and edited to change the message to whatever you want before it is posted to the front page.I attach a few screen captures.
  • one showing the welcome message with the user name when the user logs in; this message disappears when the user moves away from the home page.
  • the second one shows the welcome message first as a link on the main menu and as a block that can be edited to say whatever you wish.  When the Welcome link on the main menu is clicked, the welcome message appears.

    This screen capture shows the welcome message when the user logs in, and on the left sidebar as a block


This screen capture shows the welcome message when the user clicks on the Welcome tab; the message also appears on the left sidebar as a block

  • This screen capture shows a configuration form which is editable; the message can be put in this form, saved, and called up in a block which is placed on a sidebar


    This screenshot shows a message in a block placed in the left sidebar with the name of the user.; a welcome message is also shown when the Welcome tab is clicked.

Creating a custom module in Drupal 8 to establish a database and tables

This project demonstrates the creation of a database and tables in Drupal 8 with a custom module developed programmatically.  The module also pulls out data from the tables and presents the results in a table on the front page.The project makes use of an info.yml file, and an install file to create the database and to set up the tables in phpMyAdmin.  A routing.yml file and a Controller were included to display the result.The tables were completed manually with data through phpMyAdmin.The Drupal files were downloaded from Acquia.com using Acquia Dev Desktop where the site was also created.The table below shows the results of the module upon querying the database and pulling out the names of the soccer players in a table.


Table showing the names of the soccer players.  Note also the block on the left sidebar.

Tuesday, January 21, 2020

Creating A Registration Form for Emily School of Art

A few months ago, I created a website for Emily School of Art and now she asked me to design a registration form for her students.  This form was prepared with PHP, HTML and CSS and includes database creation with tables, connection to the database with mysqli, error flagging, SQL scripts to fill out the tables, etc.
I present below two screenshots of the registration form before and after someone registers.


Emily School of Art Student Registration Form


Registration Form after someone has signed in

Thursday, January 9, 2020

Painting a Micro Focus COBOL web Form by direct coding.


Painting a Micro Focus COBOL web form by direct coding

I developed a simple Micro Focus COBOL web form and started to paint it by adding a label, a button and a textbox to it.

First, I dragged a label from the Toolbox on to the form and changed the text property to COBOL Message.  The ID was given as lblCobolMessage.  This procedure worked fine.

Next, I dragged a button on to the form and changed the text property to Show Me.  The button ID was changed to btnShowMe.

At this point, the Intellisense function kicks in and freezes the computer.  Nothing worked.  So I had to sign off and sign on again to get back to the project.

Then, I dragged a textbox on to the form, clear the text property to blank and gave it an ID of txtShowMe.  Again, the Intellisense function kicks in and froze the computer.

At this point, I thought I should go into the Default.aspx file and enter the codes directly.  This is the code for the controls in this file:

-------------------------------------------------------------------------------

<%@ Page Title="Home Page" MasterPageFile="~/Site.master" AutoEventWireup="true"

    CodeBehind="Default.aspx.cbl" Inherits="WebApplication4._Default" %>


<asp:Content ID="HeaderContent" runat="server" ContentPlaceHolderID="HeadContent">

</asp:Content>
<asp:Content ID="BodyContent" runat="server" ContentPlaceHolderID="MainContent">
    <h2>
        Welcome to Micro Focus COBOL ASP.NET!
    </h2>    
    <p> 
        To learn more about Micro Focus visit <a href="http://www.microfocus.com" title="Micro Focus Website">www.microfocus.com</a>.
    </p>
    <p> 
        <asp:Label ID="lblCobolMessage" runat="server" Text="COBOL MESSAGE"></asp:Label>
    </p>
    <p> 
        <asp:Button ID="btnShowMe" runat="server" Text="Show Me" 

OnClick="btnShowMe_Click" />
    </p>
    <p>
        <asp:TextBox ID="txtShowMe" runat="server" Text=" "></asp:TextBox>
    </p>
    <p> 
        &nbsp;</p> 
    <p> 
        You can also find documentation on Micro Focus COBOL at <a href="https://www.microfocus.com/support-and-services/documentation/"

            title="Micro Focus Documentation">Micro Focus > Support and Services > Support Resources > Documentation</a>.
    </p> 
</asp:Content>
--------------------------------------------------------------------------

Next, I double-clicked the button on the webform and add the following code in the procedure division.  Here is the code for the Default.aspx.cbl file:

-------------------------------------------------------------------------------
class-id WebApplication4._Default is partial     
               inherits type System.Web.UI.Page public.
       working-storage section.
           
       method-id Page_Load protected.
       local-storage section.
       procedure division using by value sender as object by value e as type EventArgs.
       
           goback.           
       end method.
              
       method-id btnShowMe_Click protected.
       procedure division using by value sender as object e as type System.EventArgs.

           move "Great Gatsby was here" to txtShowMe::Text
       end method.


       end class.
-----------------------------------------------------------------------------------------

Now Build the project and run it (Start without Debugging).

The webform should show up in the browser.

Hit the Show Me button.

The result should be "Great Gatsby was here".
-----------------------------------------------------------------------------------------
Author's Note:  This is a very simple project.  The objective was to show how to code for the controls on a webform if you encounter the Intellisense message.  Of course, a more complicated project can be developed but you may encounter the Intellisense function.  Just to clarify, I was using Windows 10, Visual Studio 19, and the latest version of Micro Focus Visual COBOL.